User guide to STAPAC and PIPSA
Introduction
Often, kinetic parameters for enzymes such
as Km or kcat/Km are not available from
the desired species but have been measured for enzymes from other
species.
Sometimes the parameters for the enzyme of
interest were measured under different environmental conditions such as
pH, ionic strength etc. The user may be interested in characterizing
possible enzyme variants such as mutants, different isoforms etc.
Sometimes several mesurements of a kinetic parameter are available but
these differ significantly and a parameter needs to be selected.
The electrostatic potential is one of the
key determinants of enzymatic catalysis. PIPSA, Protein Interaction
Property Similarity Analysis [1,2], can be used to
aid the estimation of kinetic parameters from a similarity analysis of
the electrostatic potentials of the enzyme for which the parameter is
needed and the enzymes for which parameters are already known.
Experimentally determined kinetic parameters
for the enzyme given by the EC annotation of the given Swiss-Prot entry
are automatically extracted from BRENDA ( http://www.brenda-enzymes.info)
and SABIO-RK (http://sabio.villa-bosch.de/SABIORK)
databases by STAPAC. Links to related Swiss-Prot entries found in BRENDA
and SABIO-RK are added to the PIPSA analysis.
Current limitations are:
- Only single chain proteins can be modelled
- Neglect of protein flexibility
- Lack of user intervention in PIPSA
PIPSA incorporates the following steps:
- Retrieval of related protein sequences from Swiss-Prot (http://au.expasy.org) and of structure files from PDB (http://www.rcsb.org), MODBASE (http://modbase.compbio.ucsf.edu/) and Swiss-Model (http://swissmodel.expasy.org//SWISS-MODEL.html).
- Choice of suitable experimental structure from the PDB to use as a template for the generation of protein structural models by homology modelling. Please expand the respective section on the page by clicking on the arrow.
- Automatic generation of protein structural models for the enzyme of interest and all those enzymes for which kinetic parameters are available using the chosen PDB template structure.
- Calculation of the electrostatic potentials for all protein structural models.
- Comparison of the electrostatic potentials and calculation of
similarity indices for all protein structural models. The user has the
option to
- compare the electrostatic potential around the entire protein or
- restrict the region of comparison to a region around the active site or other regions based on the SwissProt entry. The selection of the protein regions can be done after expanding the respective section on the page (Please click on the arrow). All features with the same Swiss-Prot key will be assemblied in one region that is treated in one comparison. If you have two distinct binding regions, it is advisable to rename the key of one region to allow separate processing of the two regions.
- Display of the relations between the enzymes compared in electrostatic potential distance space in an ‘epogram’.
[1] N. Blomberg, R. R. Gabdoulline, M.
Nilges, R. C. Wade; Proteins 37, 379-387 (1999).
[2] R. C. Wade, R. R. Gabdoulline, F. De
Rienzo; Intl. J. Quant. Chem. 2001, 83: 122-127 (2001).
User guide
Parameter input page
Insert the Swiss-Prot identifier for the enzyme and species (available from http://au.expasy.org) for which you
want to estimate the kinetic parameter. The Swiss-Prot identifier can optionally be appended by an EC number, seperated by a colon (if the Swiss-Prot entry does not provide this).
Insert a valid email address
for the notification of results. By default the email address entered
during registration is used.
STAPAC will retrieve protein structures from
PDB or MODBASE and Swiss-Model that possess the same Enzyme Classification
(EC) number as the SwissProt entry you entered.
Inspection of PDB results
Insert a valid MODELLER license key. MODELLER [1] (see http://salilab.org)
is the homology modelling program from the group of A. Šali to
derive protein three-dimensional structures. It is used by this
webserver. MODELLER is available free of charge for academic, non-profit
organizations. Please obtain a valid license key from http://salilab.org/modeller/registration.html
Choose a PDB
template that you consider most suitable
for protein structural modeling of your enzyme of interest. This is
going to be used as a structural template in the subsequent homology
modeling.
Non-experimental, i.e. theoretically
modelled, protein structures from the Modbase [2] (http://modbase.compbio.ucsf.edu)
or Swissmodel Repository (http://swissmodel.expasy.org/repository)
[3] will be downloaded in case no PDB structure was found.
Points to
consider for the selection of the template:
- Coverage and identity level of how much of your sequence is covered by the PDB structure (excluding all gaps in the alignment) as well as level of amino acid sequence identity between Swiss-Prot entry and PDB sequences. These numbers are given in the first column as a maximum of all chains in an entry.
- Chains may differ in coverage and identity. Also one needs to make sure that important features of your sequence are covered by the PDB structure. The chains column gives information about the origin of the sequence and the residues involved. Also the coverage, identity and t-coffee (http://www.tcoffee.org) alignment score (higher score indicate better alignments) is given.
- RMSD (root mean square deviation) of each template to the best template gives a hint of how different the templates are. A low RMSD value indicates that the two structures are almost identical. STAMP is used for the multiple structural alignment. The domains of each Struture are extracted and the aligned all-against-all. You can see the STAMP logfile by clicking at the RMS value.
- Details of the structure to consider:
- Resolution of X-ray structure and completeness of structure.
- Conformation and state of the crystallized enzyme (the user may have to go to the primary literature).
- Whether the reaction mechanism is identical (if known, the user may have to go to the primary literature)
- Experimental conditions under which the structure was solved, e.g. pH, buffer etc.
- Number of missing residues in the pprotein structure. To see the whole list of missing residues click on the triangle.
[1] A. Šali, T. L.
Blundell; J. Mol. Biol. 234, 779-815, 1993.
[2] U. Pieper, N. Eswar, H. Braberg, M.S.
Madhusudhan, F. Davis, A. C. Stuart, N. Mirkovic, A. Rossi, M. A.
Marti-Renom, A. Fiser, B. Webb, D. Greenblatt, C. Huang, Tom Ferrin,
Andrej Šali; Nucleic Acids Research 32, D217-D222 (2004)
[3] J. Kopp, T. Schwede; Nucleic Acids Res.
32, D230-D234 (2004)
Generation of protein structural models
MODELLER [1] will be used to generate 3D
protein structural models for
- the SwissProt entry for which you want to estimate kinetic parameters
- the enzymes for which kinetic parameters were found in BRENDA or SABIO-RK
- the amino acid sequence of the template (for control and consistency checks).
A MODELLER protocol is applied that ensures
the reproduction of the side-chain orientation of conserved amino acid
residues. It consists of the following -steps:
- A ClustalW [2] multiple sequence alignment will be performed of the protein amino acid sequences to the PDB entry (used as a template structure in the following homology modeling).
- The amino acid sequence of the SwissProt entry will be adjusted in length to match the sequence covered by the PDB entry.
- Generation of initial models based on structural constraints from the PDB template structure.
- Energy minimization of the generated homology models.
[1] A. Šali, T. L. Blundell; J. Mol.
Biol. 234, 779-815, 1993.
[2] R. Chenna H. Sugawara, T. Koike, R.
Lopez, T. J. Gibson, D. G. Higgins, J. D. Thompson; Nucleic Acids Res 31
(13):3497-500 (2003).
Electrostatic potential calculations
The program UHBD [1] is used to calculate
the electrostatic potentials for all protein structural models. The
default settings include
- Maximum grid size dimension 110x110x110 grid points (an automatic screening of grid size dimensioning to ensure protein coverage is performed).
- Spacing between grid points 1.0 Å.
- Ionic strength 50 mM.
- Protein dielectric constant: 4, solvent dielectric constant: 78.
- The enzyme molecular surface is defined as the molecular surface being accessible to a spherical water probe of 1.4 Å.
- Skin thickness of 3 Å and a probe radius of 2 Å (for comparing the electrostatic potentials in a region of particular interest, such as active site).
[1] J. D. Madura, J. M. Briggs, R. C. Wade,
M. E. Davis, B. A. Lutty, A. Ilin, J. Antosiewicz, M. K. Gilson, B.
Gagheri, L. R. Scott, and J. A. McCammon; Comput. Phys. Commun. 91:57-95
(1995).
Analysis of electrostatic potential and PIPSA
PIPSA [1,2] will be used to perform a
pairwise comparison of the electrostatic potentials of the protein
structural models. The user has to decide whether to perform the
analysis for
- The entire protein (this will be performed in all cases).
- Restrict the comparative analysis to a region (sphere) around
residue(s) that are annotated in the Swiss-Prot database as
- ACT_SITE
- BINDING
- etc. all Swiss-Prot features can be selected
[1] N. Blomberg, R. R. Gabdoulline, M.
Nilges, R. C. Wade; Proteins 37, 379-387 (1999).
[2] R. C. Wade, R. R. Gabdoulline, F. De
Rienzo; Intl. J. Quant. Chem. 2001, 83: 122-127 (2001).
PIPSA results and epogram
The pairwise similarities of the
electrostatic potentials of the SwissProt entry, the enzymes with
kinetic data available from BRENDA and SABIO-RK and the PDB template
structure are displayed as a phylogenetic tree-like diagram
(“epogram”).
The user may choose the kinetic parameter of
the closest related enzyme. The reliability of this estimate depends on
a number of factors such as conformational flexibility of the enzyme,
appropriateness of the electrostatic potential to describe the enzyme
kinetics etc. and use it with care in the mathematical modeling of
biochemical network.
This result of a qPIPSA a tree-like diagram
("dendogram") which puts the electrostatic potential of the query
sequence into relation with other enzymes for which kinetic data are
available. In PIPSA, the distance matrix (SQRT(1-SI)) of the
electrostatic potential is displayed as a tree, here termed "epogram"
(from "electrostatic potential diagram"). The left side shows an
"unrooted" tree. "Unrooted" means that the relatedness of the leaf nodes
are displayed without making assumptions about evolutionary timeline.
Only the topology of the relatedness is displayed. The "rooted" tree (or
phenogram) on the right hand side suggests a common relatedness which generally does
not hold. The tree nodes are connected to other nodes by a
horizontal and then a vertical line. Please note that, in general, in
rooted tree-like diagrams, it is possible to change the order in which
sequences that are being referred to as more closely related to each
other than others, without altering the meaning of the statement.
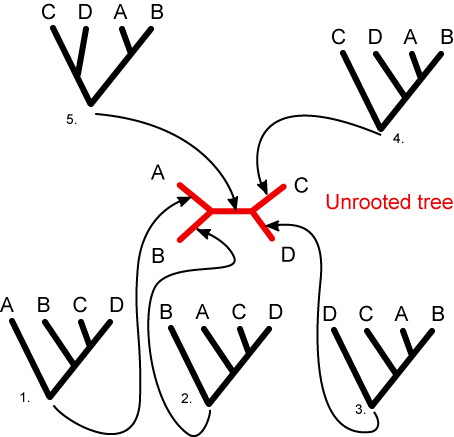
It is thus recommended to refer to enzyme's
relatedness from the "unrooted" tree diagram. From the epogram
one can estimate the kinetic parameter of interest of the
query enzyme to be sufficiently similar or close to that of its nearest
neighbour enzymes. The length of the tree branches in the epograms
does not correspond to a quantitative measure of relatedness but is
scaled for optimal display. Examples of PIPSA tree-like diagrams
("epograms") can be found at
http://mcm.h-its.org/mcmsoft/pipsa/2.0/examples.html.
Limitations of current implementation in SYCAMORE:
- Single protein chain modelling only
- Neglect of protein flexibility
- Lack of user intervention in:
- calculation of electrostatic potentials
- PIPSA analysis