Demonstration Part 3:
Example demonstrating a PIPSA analysis using multiple templates to account for the effect of conformational variability.
Part 2 demonstrate a use of webPIPSA
to analyze the relatedness of electrostatic potentials for one template structure. One can run
the same analysis and select a template with a different conformation,
to see if there are differences in similarity.
This can now be achieved automatically by selecting multiple structural templates. Each sequence is then
modelled against all templates and compared against each other. The result is not only a
comparision of the different conformations, but also how similar the two conformations are.
Please note that selecting multiple templates will significantly increase the calculation time (scaales as N2).
Demonstration for P60174 (TPIS_HUMAN), step by step
- Start by selecting the second workflow from the start page (On the sycamore server this is the default/only workflow):

- After the download is complete, enter your Modeller key (you can acquire this from the Modeller website) and
open the Structural section. You will see approx. 40 different structures from different
species obtained using different crystallization conditions. Often tere are differences
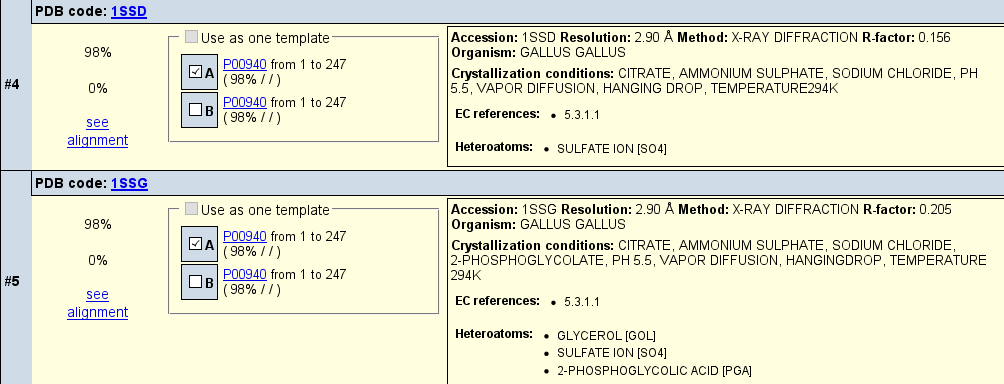
in structure due to addition of a ligand. For this demonstration, we use two chicken TPI templates, one
with a ligand bound, the other without but showing similar crystalization conditions:
-
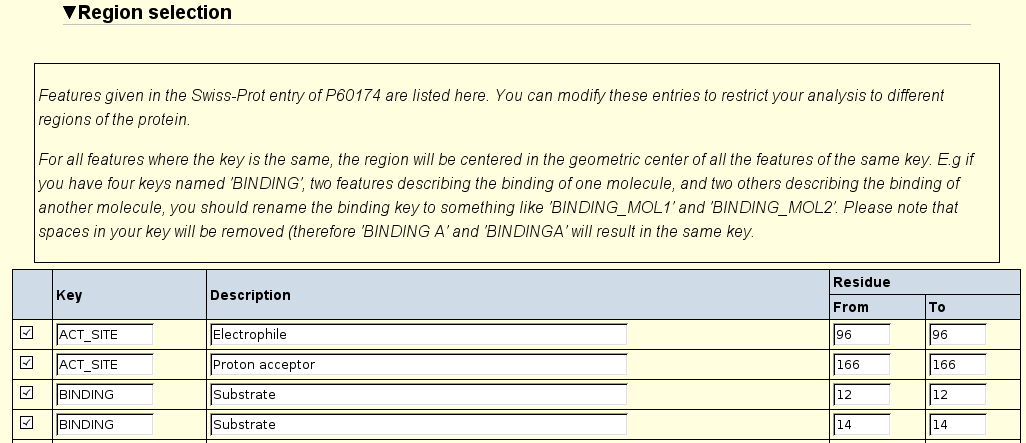
In the Regions section, one can direct the comparison towards a specific region
on the protein. Selecting Binding and Active site selects the respective
region (in addition to the whole protein).
- After pressing the Start button towards the top of the page, the workflow starts and
outputs status information about the current task.
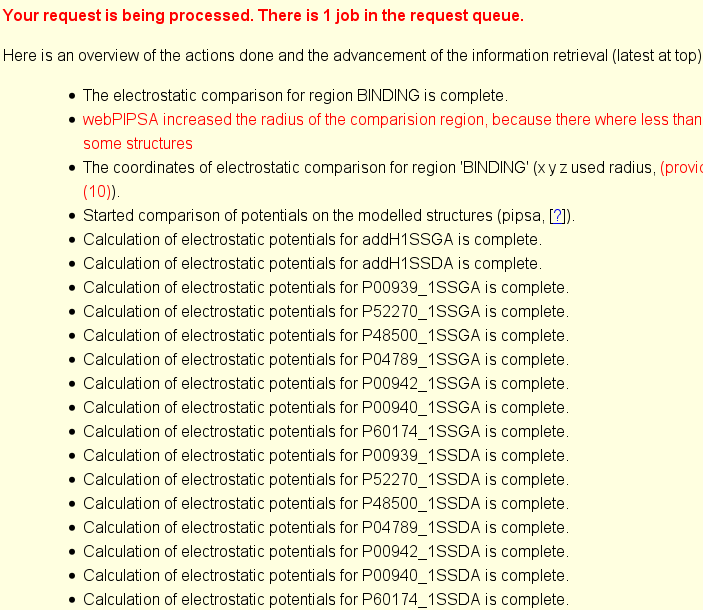
In the figure above, there is a statement about increasing the radius of the comparison region.
This is because in the selected region less than 200 grid points were found to overlap in
the skin around the surface of all proteins (see PIPSA theory page).
Therefore, the radius of the sphere used for comparision was increased from 10 to 13 Å.
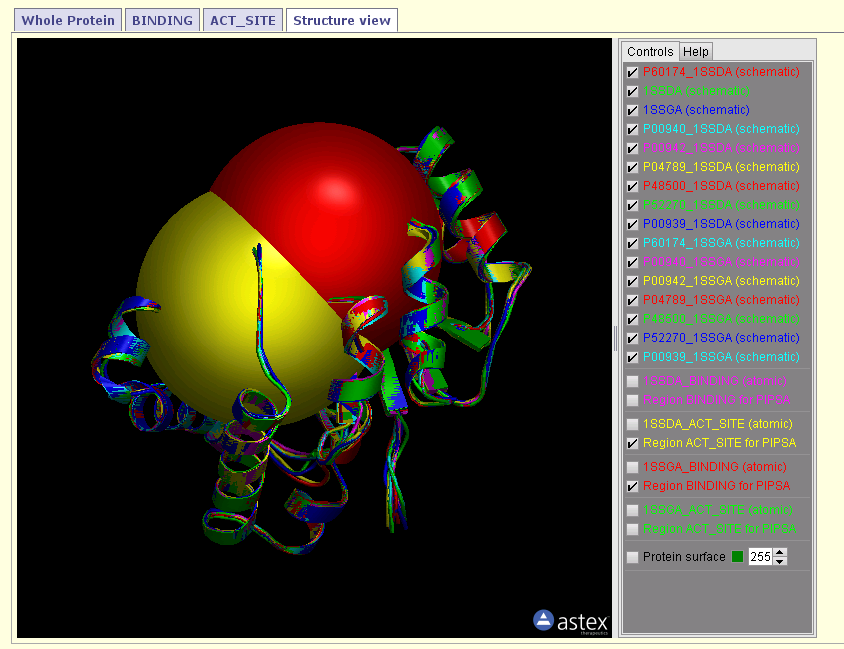
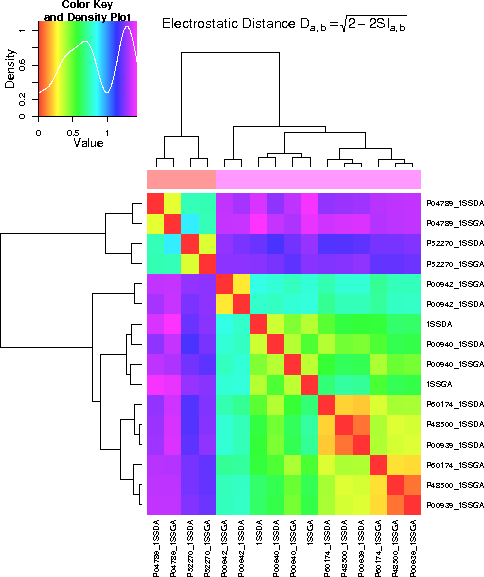
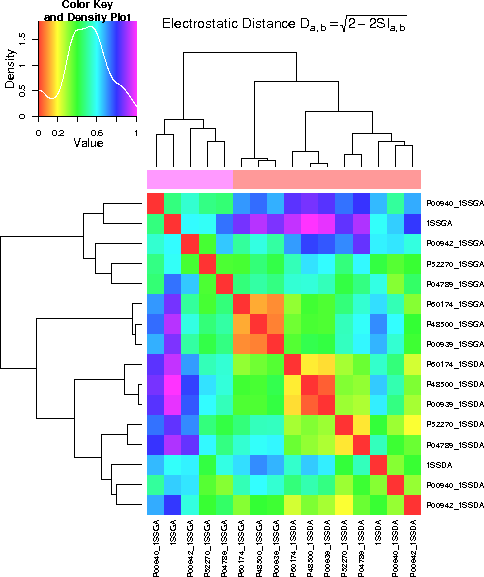
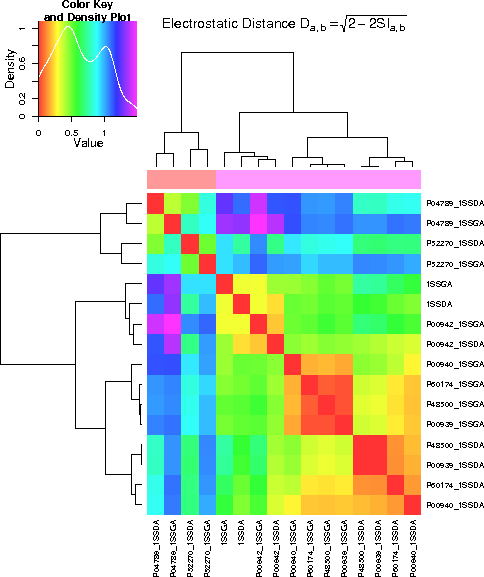
- The following pictures show the result for the whole protein, the binding region and the
region around the active site. These regions are also presented in the applet using
spheres.
Regarding the whole protein, it can be seen that the differences between the proteins are
larger than the differences between the conformations. With respect to the binding
region, the difference in conformation is more significant than the difference in
the proteins. In the active site, some proteins differ more in conformation, others
more between proteins.
- Result showing the comparison of the electrostatic potential of the whole protein. Proteins differ more than the different conformation.
- Result showing the comparison of the electrostatic potential of the binding region. The two conformations differ more than the differences between the proteins.
- Result showing the comparision of the electrostatic potential of the active site region. For some proteins, differences between conformations are more significant than differences between proteins.
- Structural view of the proteins with the focus regions for the analysis. Yellow marks the active site region, red the binding region.
