This demonstration consists of two demonstrations:
- Part 1:
- Running a standard PIPSA example (see below)
- Relating kinetic parameters to PIPSA results (see here)
- Part 2:
- Example of running webPIPSA with several protein structure templates to account for conformational variability (click here)
qPIPSA: Relating enzymatic kinetic parameters and interaction fields.
Razif R Gabdoulline, Matthias Stein and Rebecca C Wade
BMC Bioinformatics 2007, 8:373 (fulltext)
This dataset consists of the modelled structures of Triosephosphate isomerases (TPI) from different species
as described in the following publication:
Part 1: To run this example, do the following:
- Download and unpack the zipped protein structures (PDB files)
- Upload them on the PIPSA webserver using the upload applet
- On the PIPSA webserver, do not check the 'sup2pdb' checkbox, since the structures are
already superimposed. Otherwise the structures will be superimposed again and you will not be able to
restrict the analysis to a region (see below). The electrostatic potential is calculated using uhbd.
- Enter the atomic coordinates and radius of the sphere used to focus the comparison on a specific
site of the enzyme.
For the example proteins provided these are as follows:
x,y,z,Radius:
- 1.068, 4.059, 21.111, 15 (binding site)
- 8.15, 3.54, 34.83, 15 (catalytic loop)
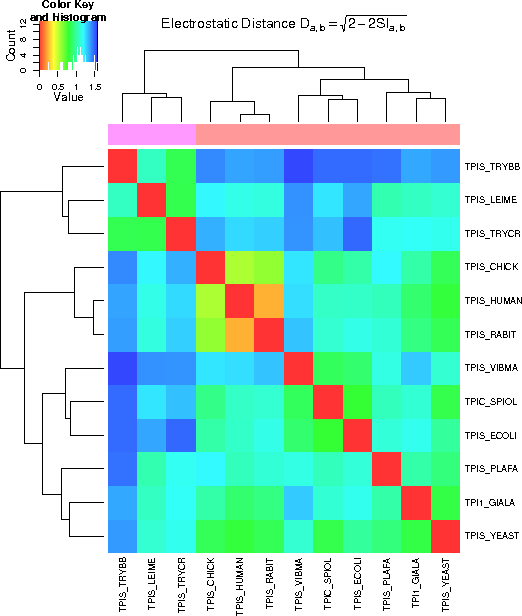
The result will be displayed as an image (as below) relating the TPI enzymes of the different species according to
electrostatic similarity.

The distances calculated from the similarity indices for the electrostatic potentials are shown in a
color coded matrix view (heat map). Red/orange colors indicate similar potentials, whereas blue color
marks proteins with more distant electrostatic potentials.
The tree along the side of the image group the proteins into groups of similar electrostatic potentials.
Part 2 for relating kinetic data:
This
example shows, how the qPIPSA approach can assist in the validation as well as estimation of kinetic parameters.


