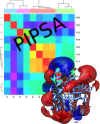
Hints for visualizing electrostatic potential grids of proteins
A variety of programs is capable of visualizing electrostatic potential grids. The method described here
is for
VMD.
Similar methods can be found for
PYMOL
(
Electrostatics in PyMOL) or
Chimera (
Chimera Volumetour).
Step by step manual for visualizing electrostatic potentials of webPIPSA in VMD
- Download and unzip the zip file containing structure and grid files from the results directory. This file
is available either from a link in the email you receive after completion or from a link on the results page.
- Start VMD and open the FILE -> NEW MOLECULE dialog.
- Use the BROWSE button to navigate to your PDB file (located in the pdbs subfolder) and load the file.
- Use the BROWSE button to navigate to the grid file belonging to the loaded PDB file (located in the uhbd or apbs subfolder. Load the grid file. Close the New Molecule dialog.
- Open the Graphics -> Representations dialog.
- One representation is for the molecule, two additional representations are needed for the electrostatic potential display.
- Press the button Create Rep and provide the following settings:
- set Coloring Method to ColorID
- set Drawing Method to Isosurface
- set Draw to Solid Surface
- set Show to Isosurface
- Repeat the procedure above for a second Isosurface representation.
- In one representation set the Isovalue to -0.5 and the ColorID to 1 (red)
- In the other representation set the Isovalue to +0.5 and the ColorID to 0 (blue)
- In the representation for the molecule you may set the Drawing method to New Cartoon if you wish.
In case you have choosen UHBD as tool for calculating the electrostatic potentials, an additional grid
file is provided. This additional grid file has the electrostatic potentials inside the protein set to 0.
This allows for a clearer visualization of the outer electrostatic potentials.
Please remind, PIPSA calculation only use a skin around the surface of the protein for comparing
the electrostatic potentials.

